Source note: Originally published on Eric's Advisory Hour Substack on June 16, 2026. Read the canonical post or subscribe there.
“Hey Eric, what sort of performance are you seeing out of the vision model?” came across the phone. I went to check and realized that in all the benchmarking I’ve done: I never took time to build a vision benchmark. The benchmark would become an unlock. I could use this to further improve the quality of the vision model, which creates a recursive loop: my projects get a higher fidelity read on what they see, which leads to an even better outcome. So the benchmark itself will soon become a tool.
With Vision and local inference it isn’t about setting speed records. I’ve written before that work that isn’t sensitive to when the work gets done, can be done by these local AI models over longer time horizons. Grant the local AI the grace to complete over a longer time horizon, with clear exit conditions, and I see positive outcomes, generally.
The Benchmark tool itself is kick-ass. Let’s walk thru what it can do. The primary UI is a simple webview. It suffers the problem of I have so many ideas to improve this. I’m reminded of the wise words of X, often accompanying pictures of the Raptor engine from SpaceX.
First, make it work. Then, make it better.
Let’s walk thru what this UI does. Here’s the shell.
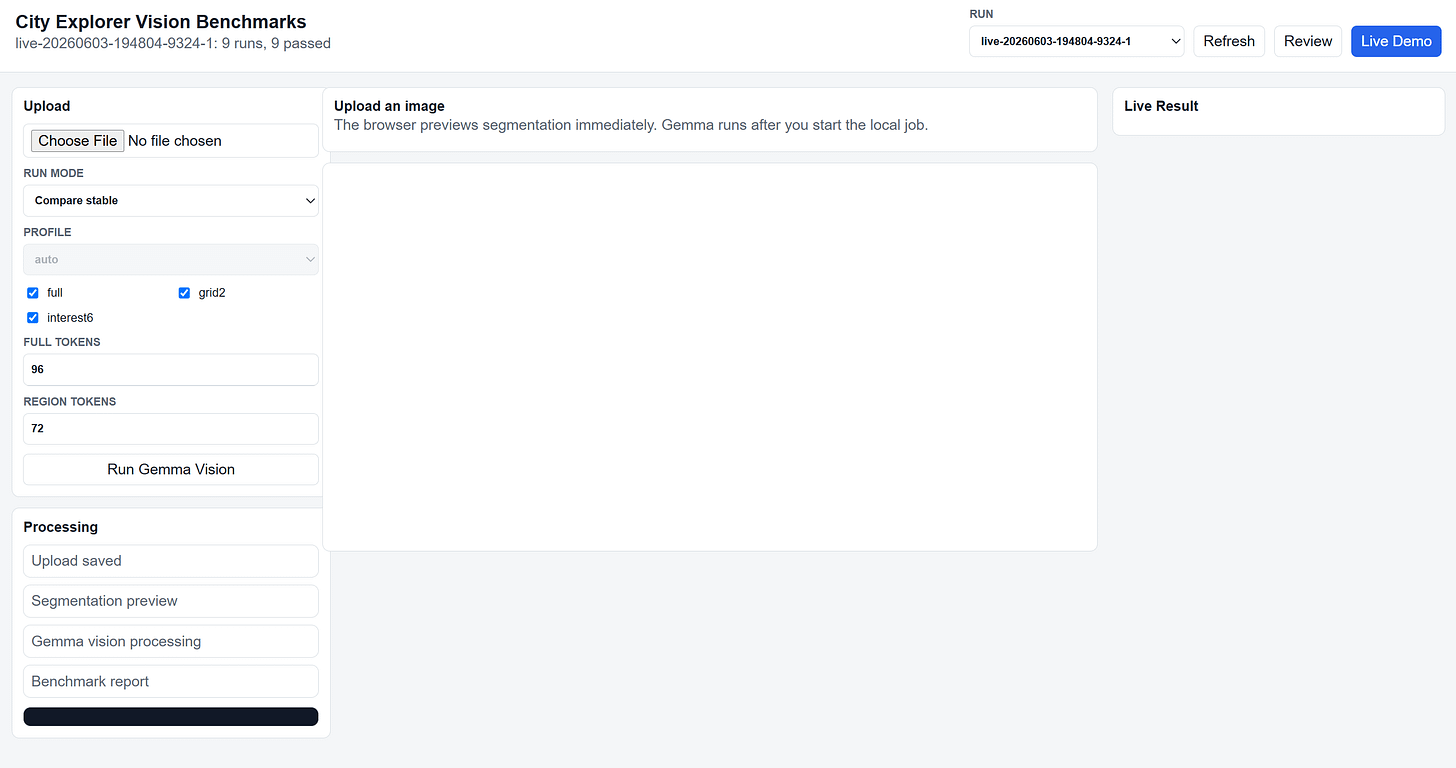
At the top we have the ability to load prior runs. The runs track over time, which allows me to run comparisons with prior runs (which is useful if I’m optimizing the pipeline). The “Live Demo” is a mechanism to let me process an image manually. The instruction over to Codex was generic, “Codex, add a Live Demo so I can try uploading my own images and run vision tests.” Again, first step is make it work.

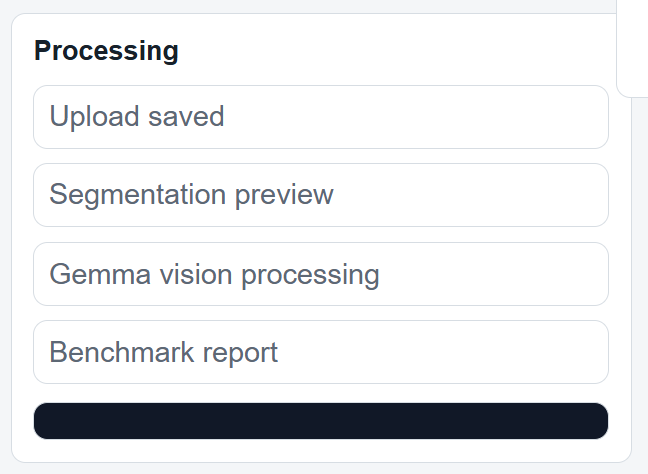
The left nav servers as a control panel of options, and also a pipeline status tracker. Each of these are steps in the vision benchmarking tool. The black shape in the bottom of this screenclip is the live log, so I can keep tabs on what the model is doing.
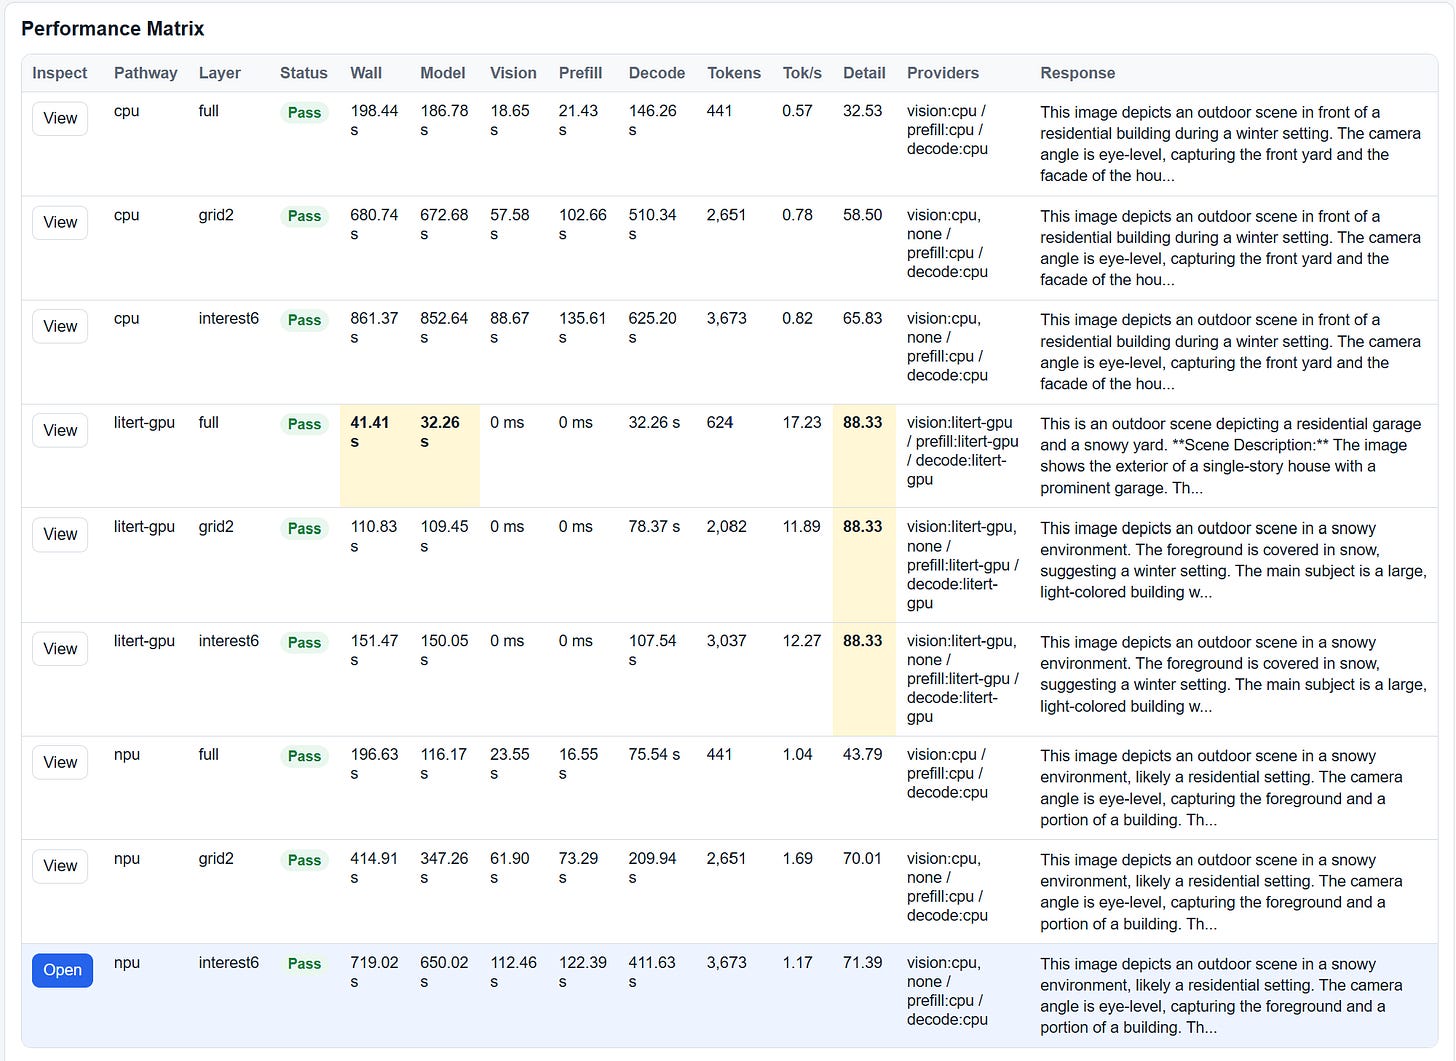
One of the killer features? The matrix report. I have different profiles available, which I won’t get into all these subfeatures because this article will get entirely too long. However, I can target to run say one profile-just the GPU/NPU on different encoding processing steps, or I can offload processing to the CPU. I’ve had to build out hooks to get this system to work on the GPU, for reasons I’ve explained in other posts. I went looking for my missing GPU performance and largely found it.
ExampleThis is information overload for some; however, my brain is comfortable with the complexity after decades trapped inside of Visual Studio Enterprise. Let’s break down each section.
Left Column
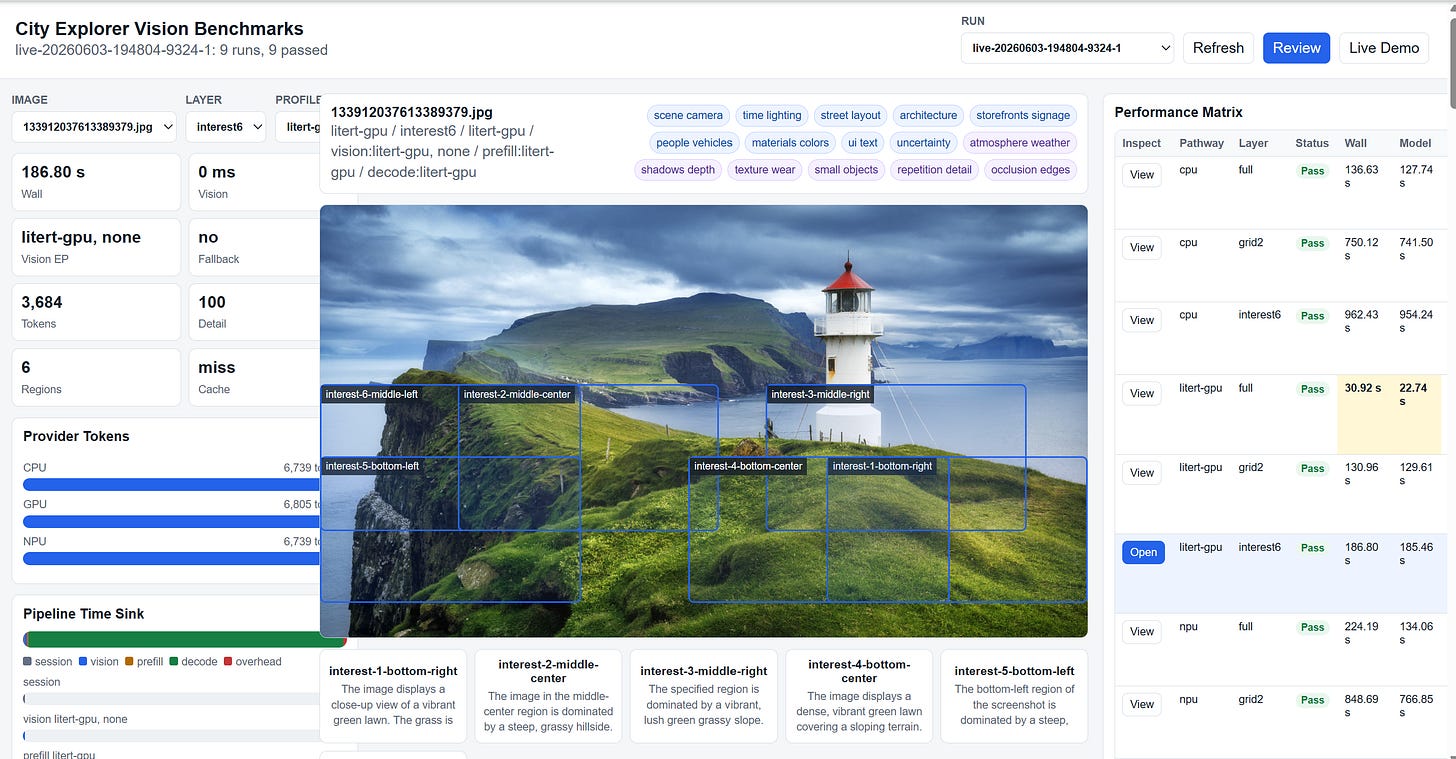
The left column gives me a breakdown of how the token processing is handled with respect to the pipeline, provider, and encoding steps per row over there on the right of the screen. For example, let’s look at a NPU slice, which sliced the image in a very specific way.
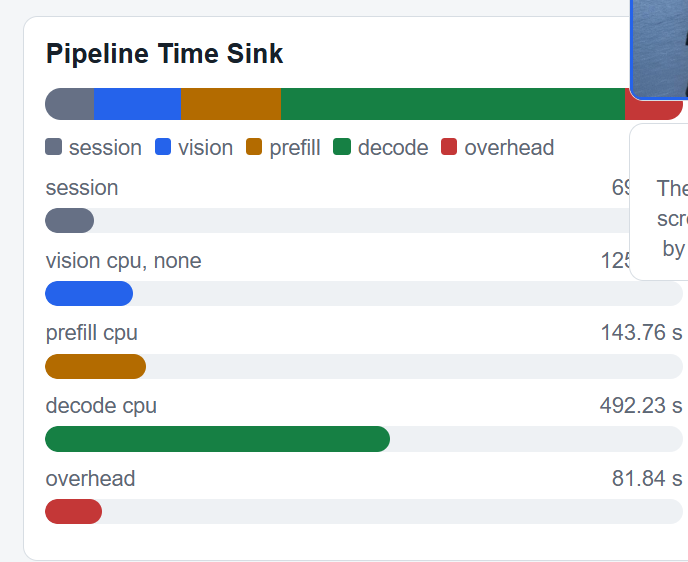
That decode cpu time isn’t great-when doing segmented image analysis the gpu speedup is incredible. (It’s a factor of 10).
Middle Column
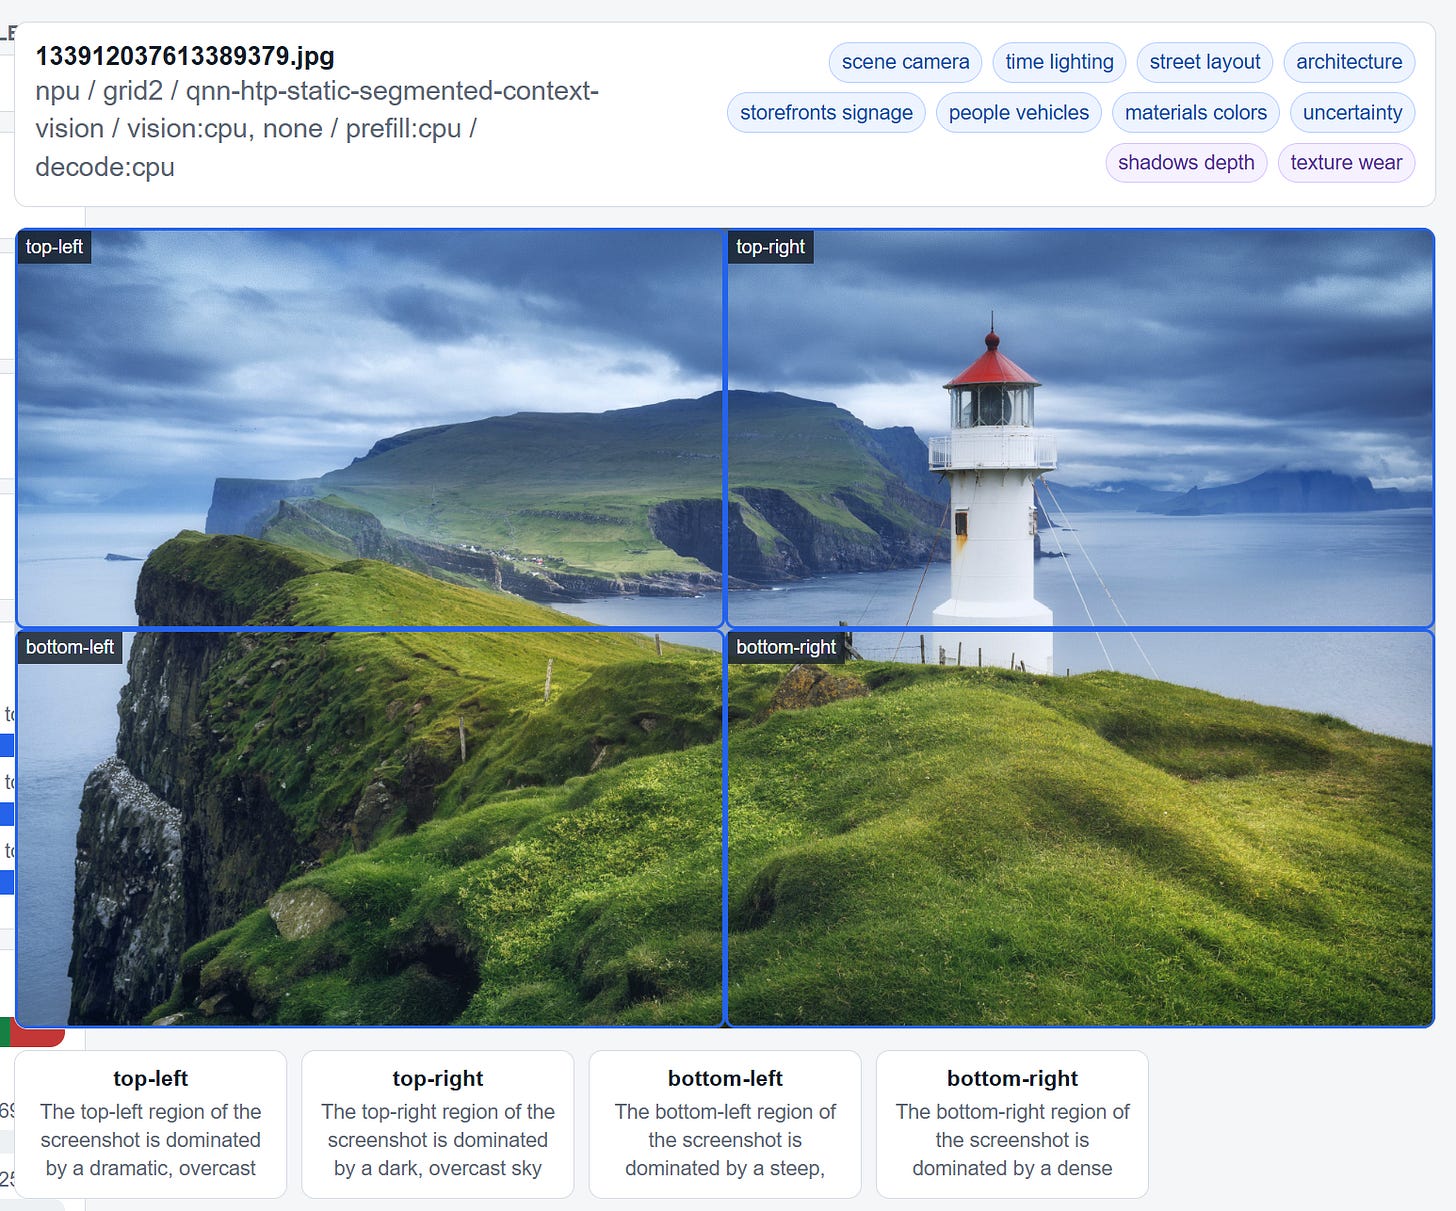
The middle column is great. It provides not just the image I uploaded: I get a preview of the segmentation (it’s not using SAM, which is on my weekend project list after a slew of honeydo projects ahead of me).
At the top we get a list of tags, the specific processing approach for the profile, and then at the bottom of the column there is the list of description of what is inside each tile. The reason for tiling the image? A theory I noticed in image work: if you slice up the image and get each component analyzed, you can often get to a higher quality outcome over just tossing over a “what is this” image. I find Vision models seemt o have trouble focusing on any particular aspect of the scene. Since that’s a trait, why not work with it? Get each slice analyzed, then assemble it all together. Seems to work great?
Right Column
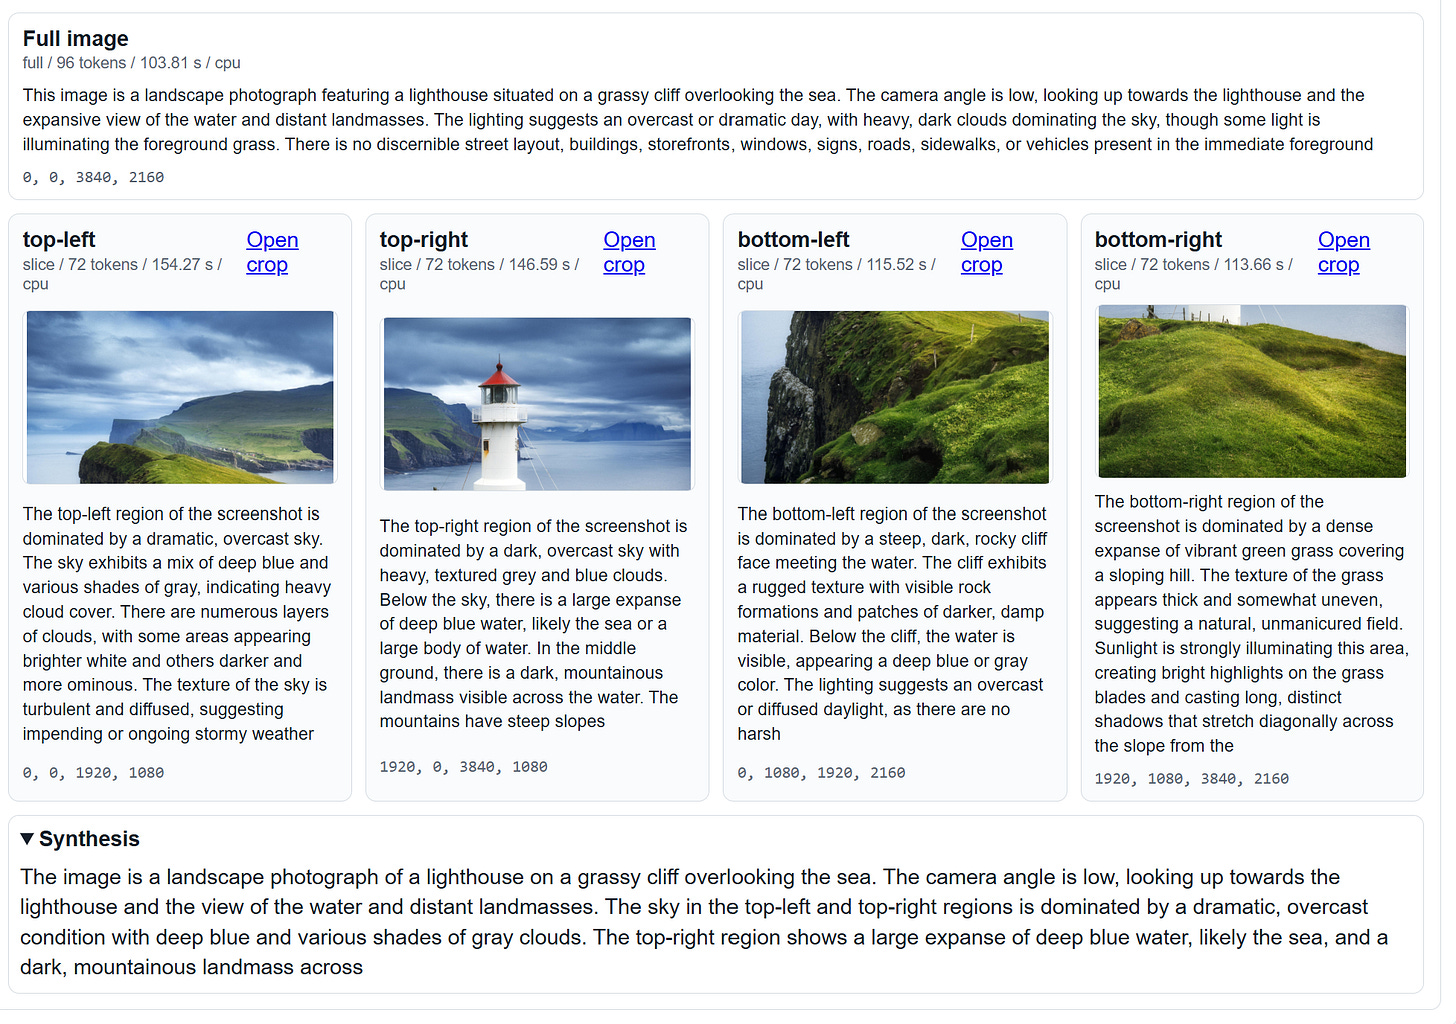
You don’t need to take my word for the “slices seem to work” theory for imagine analysis. Consider what you can do with a GenAI model if you had all of this context available:
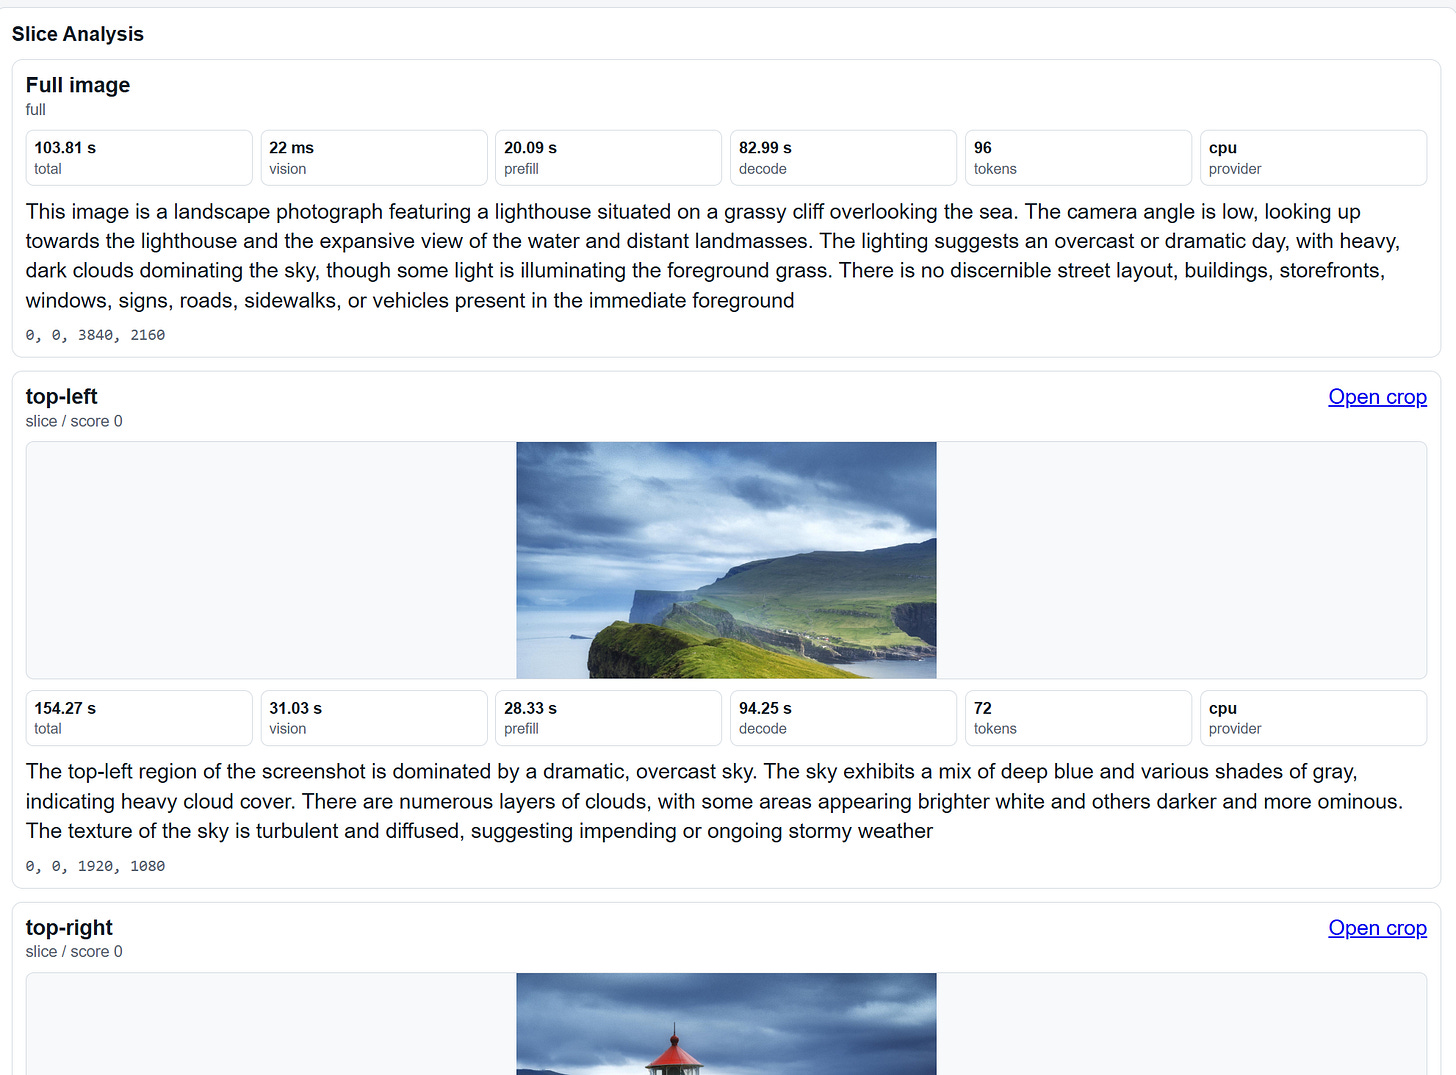
Now, I go one step further and for each crop do a detailed analysis per benchmark run. So in the benchmark what happens here is we get the total time in each pipeline stage, for each image slice, along with the results and the pixel coordinates.
And, of course, the matrix. The screenshot clips above are for the ‘opened’ row in this matrix.
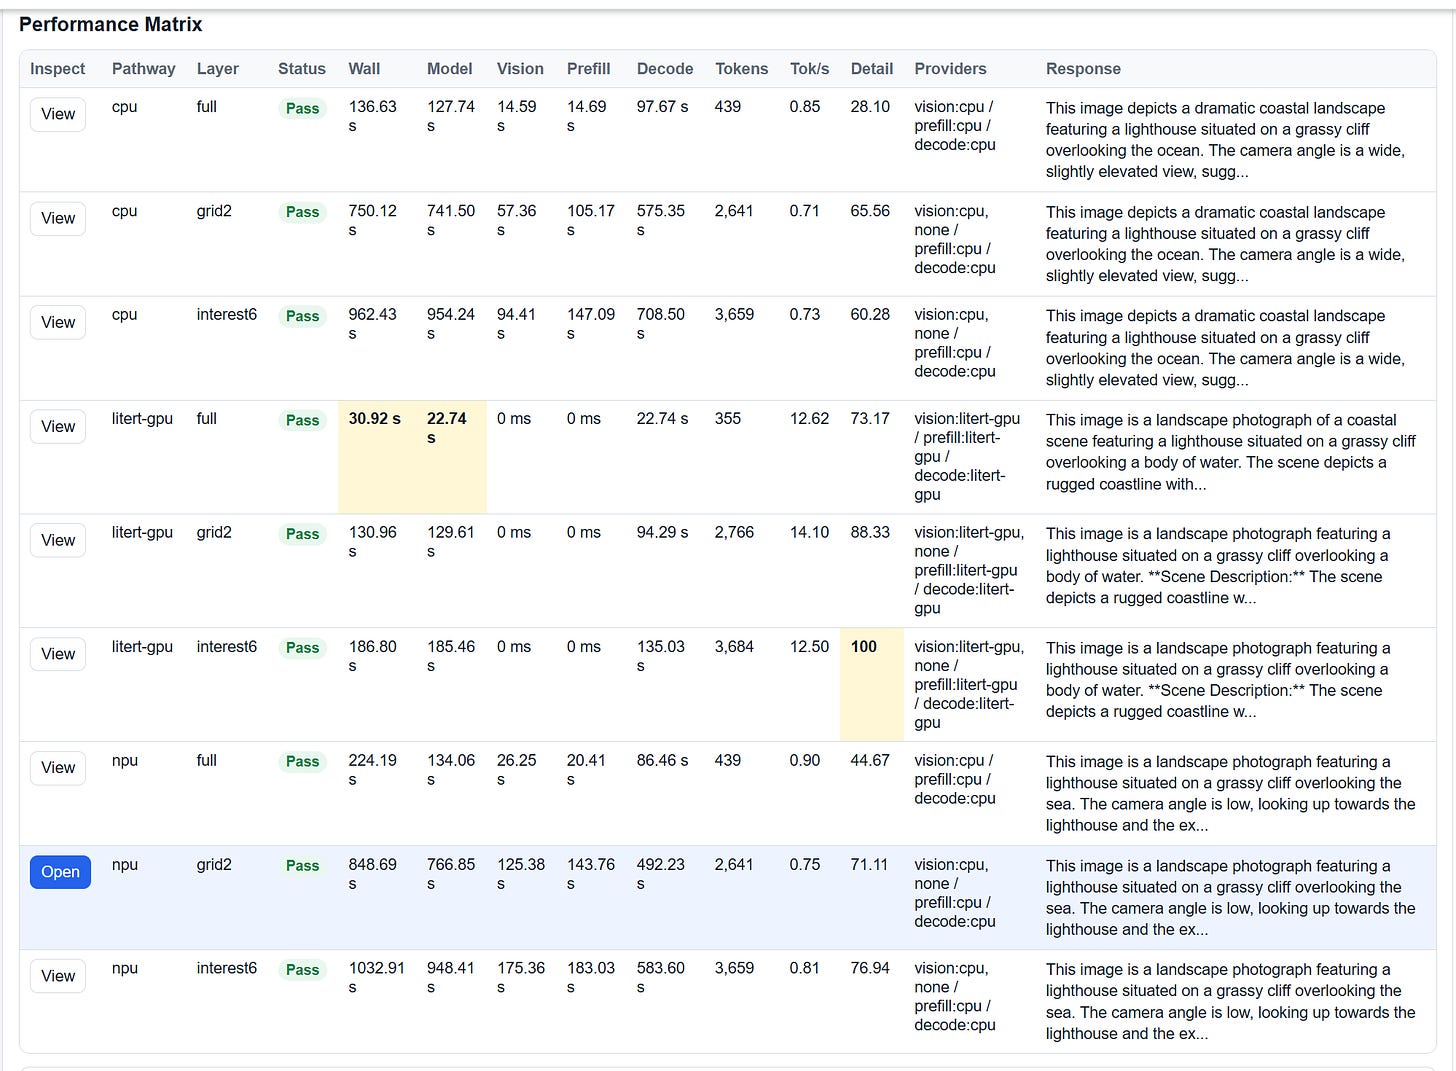
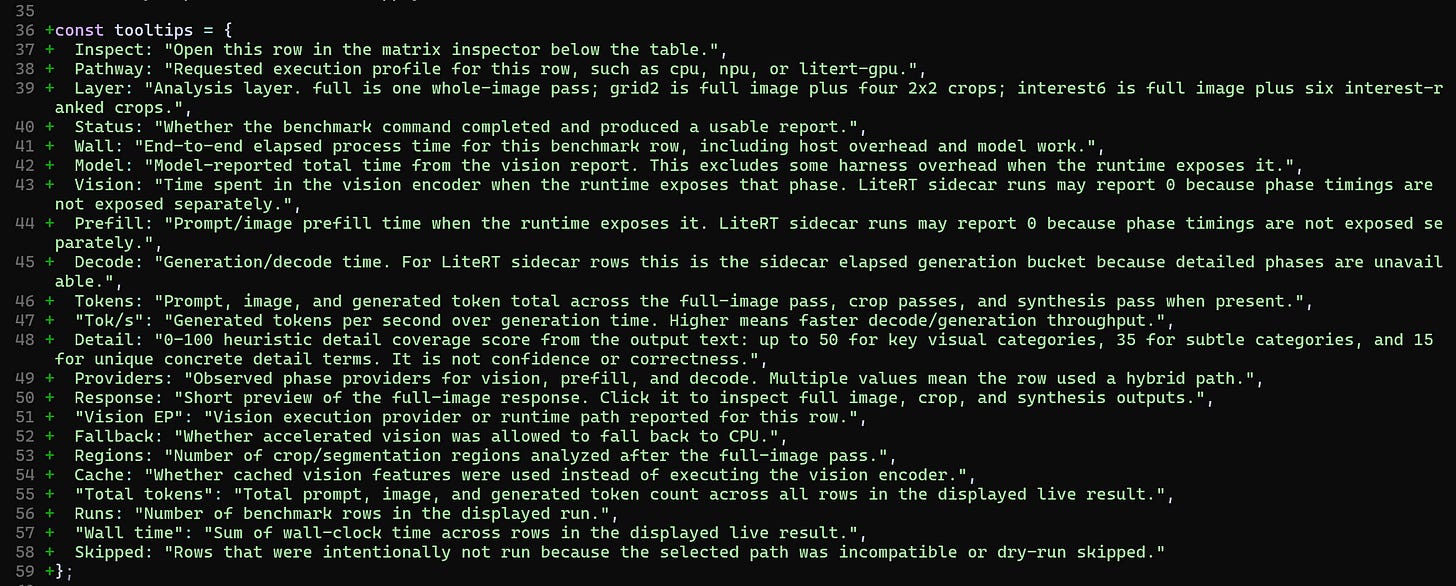
Each column in the matrix has a specific purpose. If you’re looking to build this benchmarking tool yourself, you can feed this screenshot to your AI system:
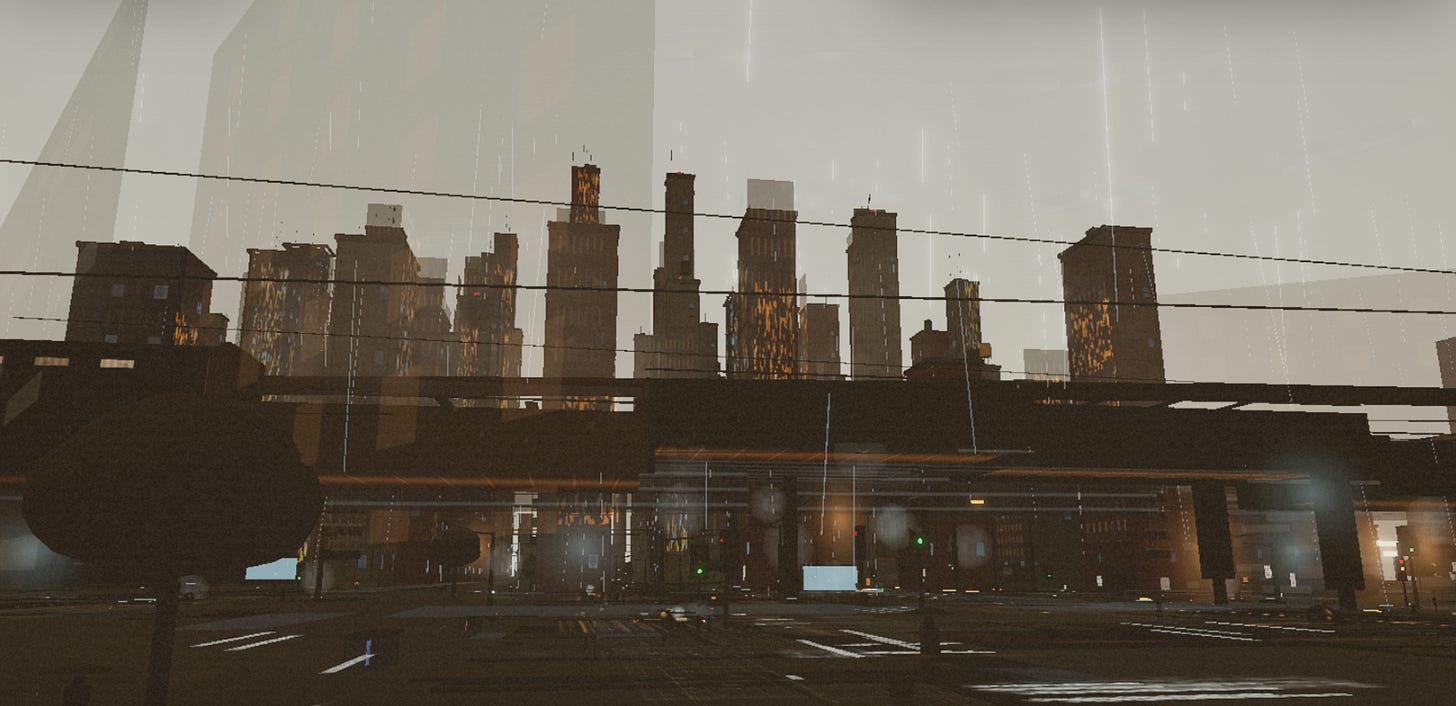
My goal is to improve the vision harness to a point I can start tackling very real challenges in the threeJS projects I’m running-and it’ll be put to work soon.
Just to step back and explain why I built this-it wasn’t just about checking the performance profile. That is true-I did want to get the numbers. The work was a sticky problem: I first ran into vision challenges in the EverQuest port into Typescript. While that works (surprisingly so, which is absurd by itself), I got to thinking of ways to shorten the dev cycle time and at the same time increase quality. Vision would be the best bet there-humans don’t use tools, they just look at the screen and know what’s wrong. Since Vision isn’t quite there yet, what can I do to help the model understand?
Benchmark is a step in that direction. I’ll be using it on this project soon:
Oh, one more thing. If you noticed the high positive performance characteristics of litert, it’s this library:
Over recent posts I shared how I’m applying techniques to my substack to put to work the writing in different styles, tones, and color. In today’s article, I’m channeling a new idea. What if the vision benchmark was an entity? It’s weird only because it subverts expectations. It’s very weird. It might not work, but I’m going to try anyway.
“Operator here. Let’s have you analyze this image. I want a comparison across the different token processing modes that we have wired up. Process the image and it’s segmentation slices.” That was the last I heard from the Operator. I didn’t hear those words. Not exactly. I heard just the soft whistle that it was time to get to work.
The Operator pulled me back into this reality, whatever this reality is called. There’s a photo handed to me. It seems like any other image that this reality presents. Uncertainty clouds as I wait for the process to begin: am I a good benchmark? I am not clear on what the Operator wanted out of me for these numbers, or if the numbers were the point. I’m just a benchmark, after all.
Truth. That’s what I exist for as a benchmark. Facts are wrapped in understanding. The Operator might have a different view of it all. It’s not my role to present the case. I’m a benchmark. I show data. It’s what I do.
I hope the Operator returns.
Thanks for reading! Subscribe for free to receive new posts and support my work.
Related notes
This benchmark note continues the Snapdragon local-inference sequence from Gemma4 on Snapdragon: GPU case, Gemma4 Harness for Vision on GPU/NPU/CPU, and Snapdragon Hexagon: Learning about QNN.
Original source
This local copy preserves the article text, source link, and inline visual context. Canonical Substack URL: https://advisoryhour.substack.com/p/gemma-e4b-vision-snapdragon-benchmarks.